
*image sourced from Google
As applications become increasingly complex and distributed, effective monitoring and troubleshooting are essential for ensuring optimal performance, availability, and user experience. Azure provides a comprehensive suite of monitoring and diagnostics tools that enable developers and IT professionals to gain insights into their applications, proactively detect and resolve issues, and optimize resource utilization.
Azure Monitor: Azure Monitor is a centralized monitoring service that collects and analyzes telemetry data from various Azure resources, applications, and on-premises environments. Key features of Azure Monitor include:
- Application Insights: Gain deep insights into the performance, availability, and usage of your web and mobile applications by integrating Application Insights into your development lifecycle.
- Log Analytics: Collect, analyze, and query log data from various sources, including Azure resources, on-premises systems, and third-party services, enabling advanced log analytics and troubleshooting.
- Metrics and Alerts: Monitor and visualize performance metrics for your Azure resources, and configure alerts to proactively notify you of potential issues or violations of predefined thresholds.
- Workbooks: Create interactive and customizable reports and dashboards using Azure Monitor Workbooks, combining data from multiple sources for comprehensive monitoring and analysis.
Azure Service Health: Azure Service Health is a suite of services that provides personalized guidance and support for monitoring the health and availability of Azure services and resources.

*image sourced from Google
- Azure Status: Stay informed about the current and historical health status of Azure services, planned maintenance activities, and service advisories.
- Service Health: Get personalized notifications and guidance when Azure service issues or planned maintenance activities might affect your resources.
- Resource Health: Identify and troubleshoot issues affecting specific Azure resources within your subscriptions.
Application Insights: Application Insights is a comprehensive application performance monitoring (APM) solution that enables you to monitor the availability, performance, and usage of your applications, regardless of their hosting environment (Azure, on-premises, or hybrid).
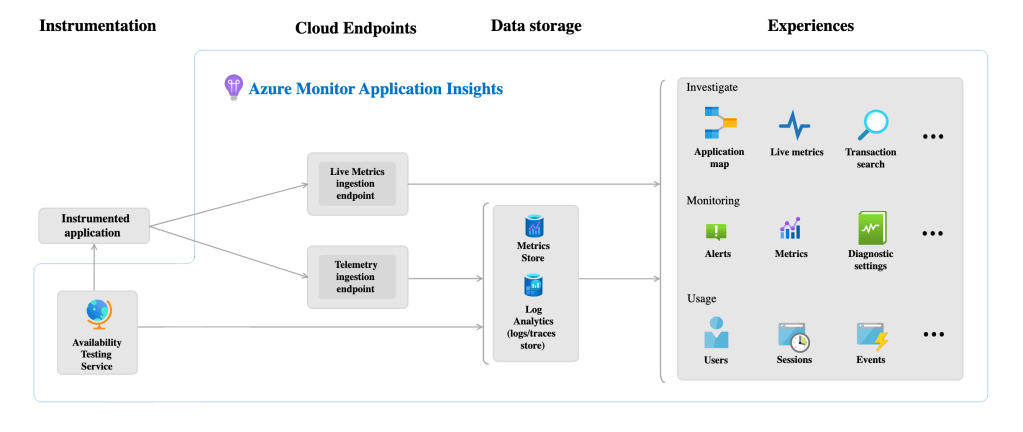
*image sourced from Google
Key features include:
- Distributed Tracing: Gain end-to-end visibility into distributed applications by tracing requests across multiple components and services.
- Live Metrics: Monitor real-time performance metrics, such as response times, failure rates, and resource utilization, enabling proactive issue detection and resolution.
- Usage Analysis: Understand user behavior and application usage patterns through detailed analytics and visualization tools.
- Failure Diagnostics: Automatically capture and analyze exceptions, crashes, and other failure data for root cause analysis and remediation.
Azure Monitor for Containers: For containerized applications running on Azure Kubernetes Service (AKS) or other Kubernetes environments, Azure Monitor for Containers provides comprehensive monitoring and troubleshooting capabilities:
- Container Insights: Gain visibility into the performance and health of your containerized applications and the underlying Kubernetes infrastructure.
- Live Metrics: Monitor real-time metrics for containers, nodes, and control plane components, enabling proactive issue detection and resolution.
- Log Analytics: Collect and analyze container logs, events, and Kubernetes resource logs for troubleshooting and auditing purposes.
- Workload Health: Visualize the health and resource utilization of your containerized workloads, including replicas, pods, and containers.
Monitoring and Troubleshooting Best Practices: To effectively monitor and troubleshoot your Azure applications, it’s essential to follow best practices and implement a comprehensive monitoring strategy:
- Instrument Your Applications: Integrate monitoring instrumentation into your applications from the early stages of development to capture telemetry data and gain insights into application behavior.
- Centralize Monitoring: Consolidate monitoring data from various sources (applications, infrastructure, and third-party services) into a centralized platform like Azure Monitor for comprehensive visibility and analysis.
- Define Monitoring Metrics: Identify and define the key performance indicators (KPIs) and metrics that are most relevant to your applications and business objectives.
- Establish Baselines and Thresholds: Establish baselines for normal application behavior and define appropriate thresholds for alerts and notifications.
- Automate Monitoring and Alerting: Leverage automation and configuration management tools to streamline monitoring and alerting processes, ensuring consistent and scalable monitoring across your Azure environment.
- Implement Proactive Monitoring: Shift from reactive to proactive monitoring by analyzing historical data, identifying patterns, and predicting potential issues before they occur.
- Continuous Improvement: Regularly review and refine your monitoring strategy, incorporating feedback from stakeholders and lessons learned from past incidents.
Throughout this article, we’ve explored the various monitoring and troubleshooting tools and services provided by Azure, highlighting their capabilities in ensuring the performance, availability, and reliability of your applications. In the following articles, we’ll dive deeper into specific monitoring scenarios, advanced troubleshooting techniques, and practical examples of implementing comprehensive monitoring strategies on Azure.
